
Hello traders
I hope you’ve all had a good week.
In last Friday’s post I discussed the importance of bond yields in determining the outlook for equities, and various other asset classes alike. I explained how stock investors were becoming increasingly anxious about the prospect of higher yields potentially limiting the current bull market, and high-multiple growth stocks especially. This move has been driven by higher inflation expectations, along with optimism around the economy reopening after COVID, which seem valid given such a low baseline last year.
So much of this can be observed in mass psychology, where the consensus seemed to be positioning for ‘the death of growth stocks’ with everyone rushing in to the ‘value’ segment. Whilst I don’t disagree with the rationale behind the so-called ‘reflation trade’ (after all, the economic outlook is positive, as I will demonstrate with our Business Cycle Checklist a little later), the rotation has arguably occurred too violently to be sustainable – at least in the short-term.
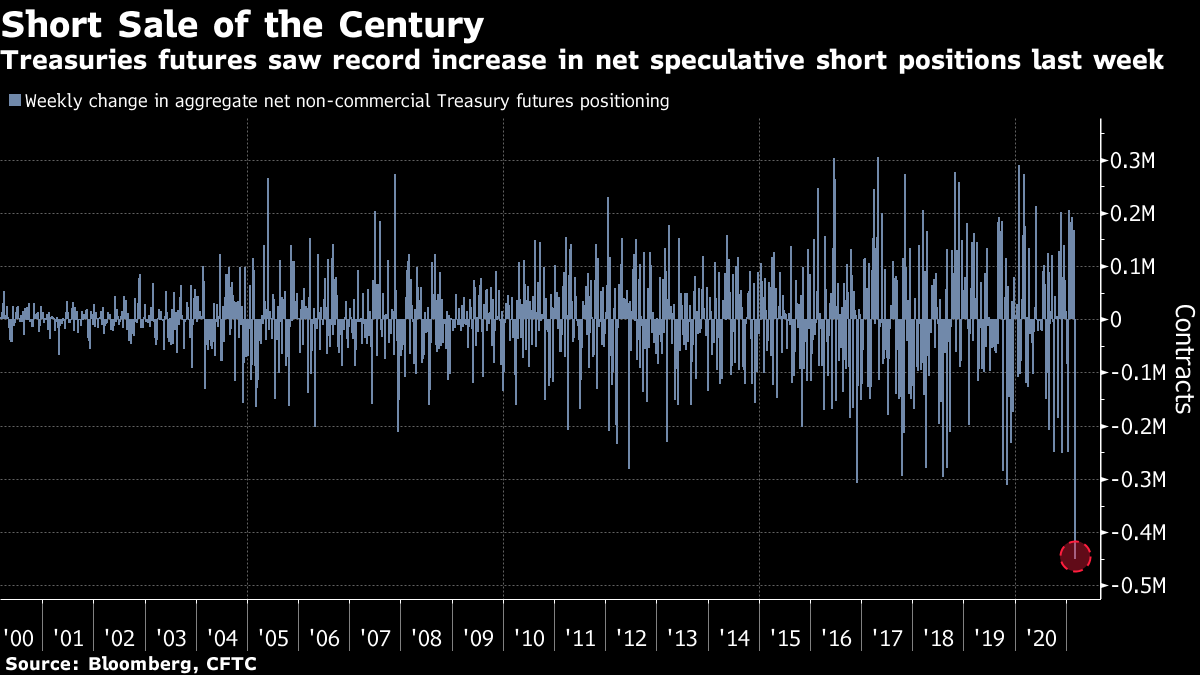
The 10-Year US Treasury bond yield which has surged to 1.60% having been around 1% at the beginning of the year, and just 0.50% in August. The following chart from Bloomberg earlier this week caught my attention. It shows how the large speculators (‘fast money’) in the market added to short bond positions at a record last week, driving (prices lower) yields higher. Very often, extreme sentiment and positioning drives markets in the short-term, so this to me suggested that the rise in yields may be due a pause.
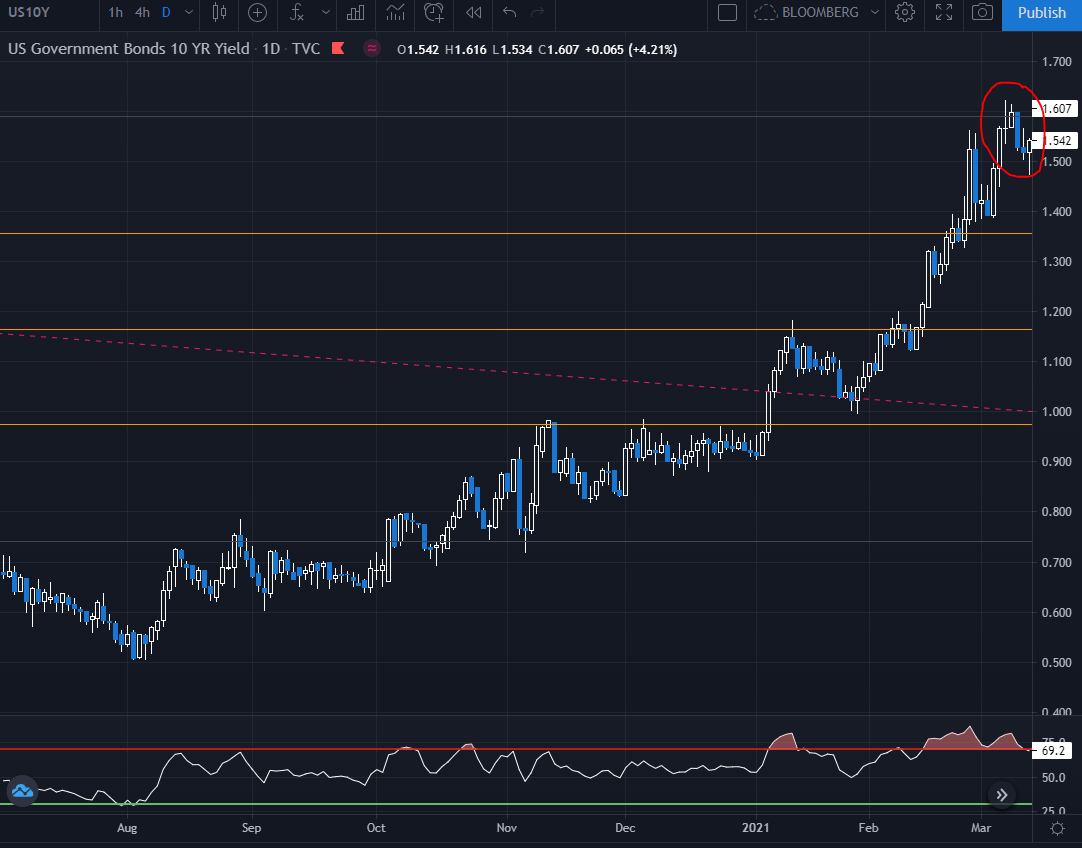
Looking to the chart of the 10-Year, you can see that we did get a reaction lower off 1.60% which also coincided with a Fibonacci retracement level and overbought RSI reading (we are seeing a squeeze higher today in early trading, which I am watching for confirmation / rejection of the possibility that yields may have peaked in the short-term).
The movement in yields (not just the level) has profound implications for momentum investors including Cathie Wood, who manages the Ark Invest ETFs. These funds focus almost exclusively on highly speculative shares primarily in tech and renewable energy, including the likes of Tesla which is her largest position. As many of the smaller holdings in the ETFs trade at extremely high multiples – and often lack profitability – they are extremely sensitive to movements in the bond market. The following chart shows the relationship between the ‘MOVE Index’ (the bond market equivalent of the VIX Index) and peaks in the ARK Innovation ETF (ARKK) as a representation of momentum trades. As the MOVE Index (bond volatility, inverted scale) increases, momentum stocks come under pressure (and vice versa).
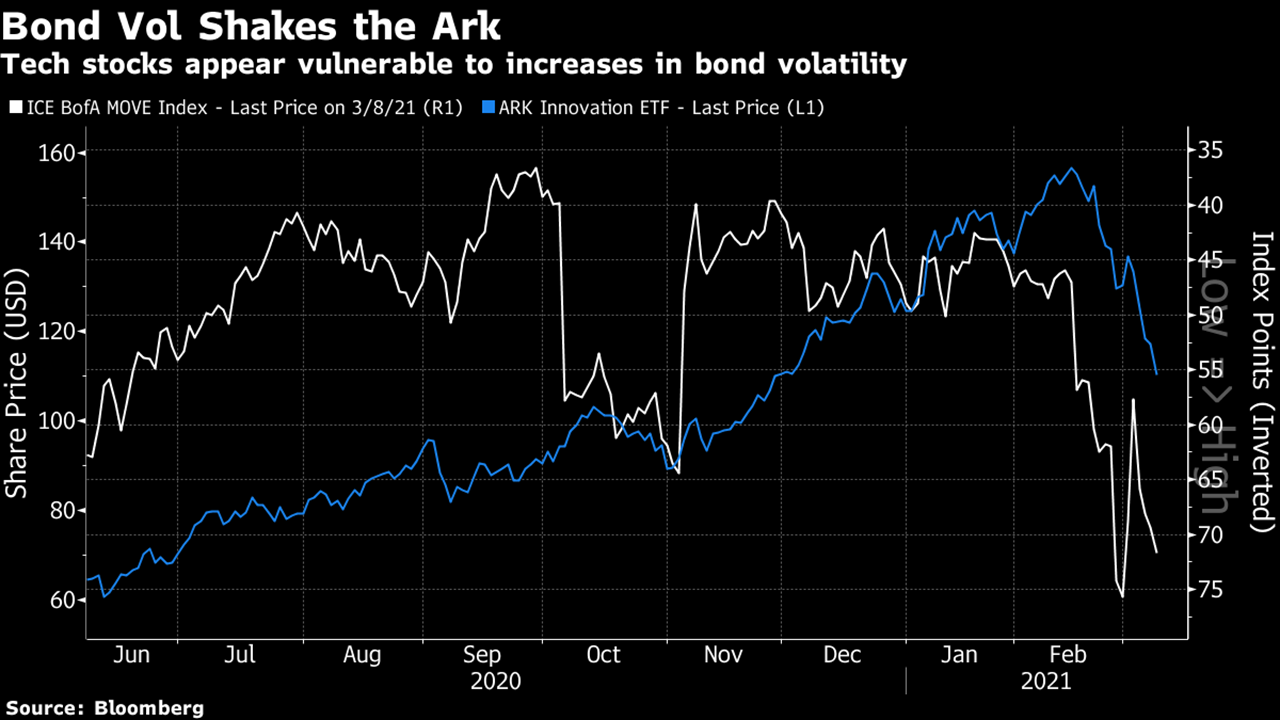
Given how the 10-year bond yield may have reached a short-term extreme, it looked as though the MOVE Index might also come in a little, providing hope for a rebound in many of the recently decimated momentum trades. There has been evidence of this happening in the past couple of days, as treasury volatility has fallen, and growth / momentum stocks have rallied.
Having examined the bond market, sentiment and technical indicators, it is important to refer to our Checklist as the cornerstone of our trading process. Here you can see the positive score presented by our Business Cycle Checklist, as I referred to earlier. This supports the path of normalisation (rising yields) longer term, and suggests that the move lower in yields (recovery in momentum stocks) may be simply a correction from a near-term extreme, and therefore short lived.

Our Market Risk Checklist further confirms this, and crucially suggests that bond yields may continue to rise along with equities, which has not been emphasised until now. Of course, there is an additional Equity Market Checklist which helps further guide our decision as Trading Club members have access to.

The key takeaway for me is that whilst bond yields may show signs for peaking in the short-term, the longer-term narrative which has driven them higher appears to be confirmed by the positive scores presented by our Checklist process. Crucially, I believe that stocks can also continue to rise whilst this outlook remains, even if the value rotation beneath the surface is here to stay following the current correction.
To learn more about our methods, and join me for more analysis in real-time, check out our MDT course and Trading Club pages where you can preview everything that we cover.
In the meantime, why not head over to our YouTube Channel for our latest FREE videos which I will be bringing to you each week in 2021! As there’s no charge for this content, it would be great if you could support the channel by leaving a comment and subscribing.
Watch this week’s videos here: YouTube Channel
Have a great weekend,
James
Disclaimer: For educational purposes only. Even though we do our best to provide reliable data, you should not trade based on this information.
© Copyright 2021 Lex van Dam Financial Education. Further distribution prohibited.

