
Hello traders
I hope you’ve all had a good week.
Equities have remained buoyant with the S&P 500 sitting just beneath a record high of 4,000. Beneath the surface, there have been impressive gains for a number of leading stocks following earnings, including some of the familiar growth names. I summarised the key moves in my video on YouTube on Thursday, which followed a Q&A video I did on my personal equity strategy earlier in the week. If you haven’t already subscribed to our YouTube channel, be sure to check it out!
Whilst there has been plenty to keep me occupied in my own trading with my stock portfolio now up more than 11% this month, I have of course been engaged with our Checklist process which I analysed for Trading Club members on Wednesday. I highlighted a couple of these setups in my last post, which included the positive scores seen for both Market Risk and US Equities. This set the backdrop for investor risk appetite and further gains in pro-cyclical assets. Here’s a reminder of how we arrived at this:
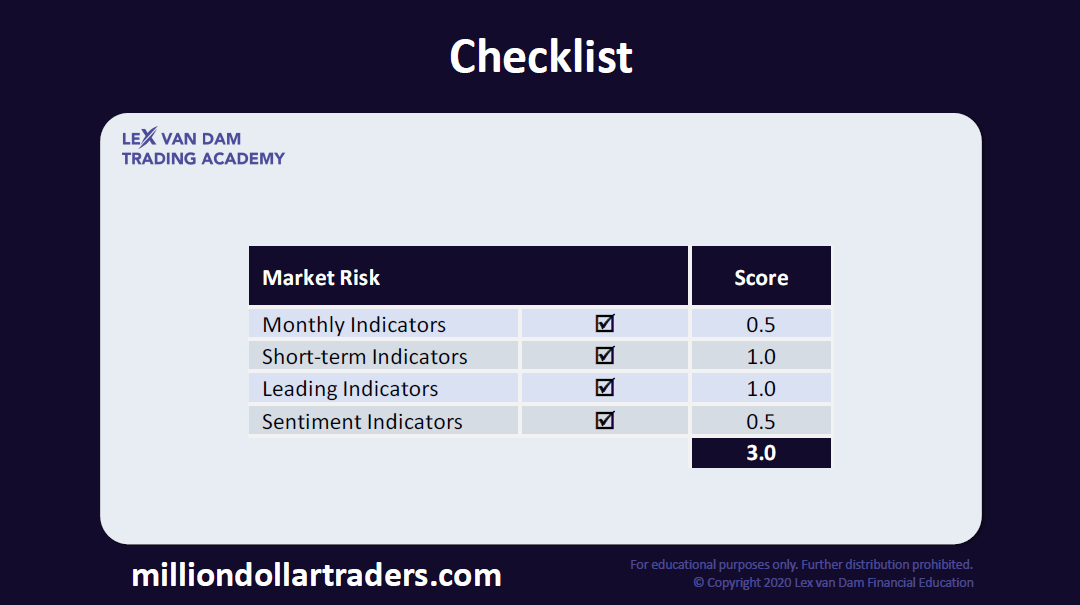
At +3, it was clearly set up for ‘risk on’ this month. The chart below shows a sustained rally in the industrial sector ETF to consumer staples sector ETF ratio (‘risk on’ and ’risk off’ proxies, respectively) towards 1.37 from 1.30 when we updated the scores on 27 January.

This has been mirrored by the gains in the most commonly owned risk market, equities. Our Checklist was set up with a +1 and confirmed the positive bias expressed by our Market Risk Checklist.

The S&P 500 is up 4% year-to-date, and has seen a strong rally off 3700 at the beginning of February. This has no doubt been driven by the successive positive scores in our Checklist which reflect the bullish fundamentals and sentiment. According to the technical picture, for as long as the positive score remains, I expect to see the market exceed 4,000 shortly with a target at the next resistance area projected around 4150 – 4200 (some 6-7% above current the level).

Notably the recent rally has come on tremendous volume, just a hair beneath the 16.1 billion average daily level seen amidst the panic in March last year. Here’s a cool chart from a Bloomberg article I read this morning.

It remains to be seen how our Checklists will adapt to the new data in the coming months, but the outlook certainly looks good to me at present. To learn more about our methods, and join me for more analysis in real-time, check out our MDT course and Trading Club pages where you can preview everything that we cover.
In the meantime, why not head over to our YouTube Channel for our latest FREE videos which I will be bringing to you each week in 2021! As there’s no charge for this content, it would be great if you could support the channel by leaving a comment and subscribing.
Watch this week’s videos here: https://youtube.com/playlist?list=PLShx-P8_HTN-OPJ0CgfeiTbl_1aCE2qMk
Have a great weekend,
James
Disclaimer: For educational purposes only. Even though we do our best to provide reliable data, you should not trade based on this information.
© Copyright 2021 Lex van Dam Financial Education. Further distribution prohibited.

