
Hello traders
I hope you’ve all had a good week!
Global equities have continued their march to new highs following last week’s record close. Following some encouraging words from the Fed earlier in the week, the S&P 500 seemed to breeze past 4000 with little hesitation and currently sits around 4100. Whilst I remain optimistic on the outlook for stocks and other risk markets on the basis of our Checklist process, I do see the potential for some profit-taking in the very near-term with the daily RSI above 70, and “overbought”.
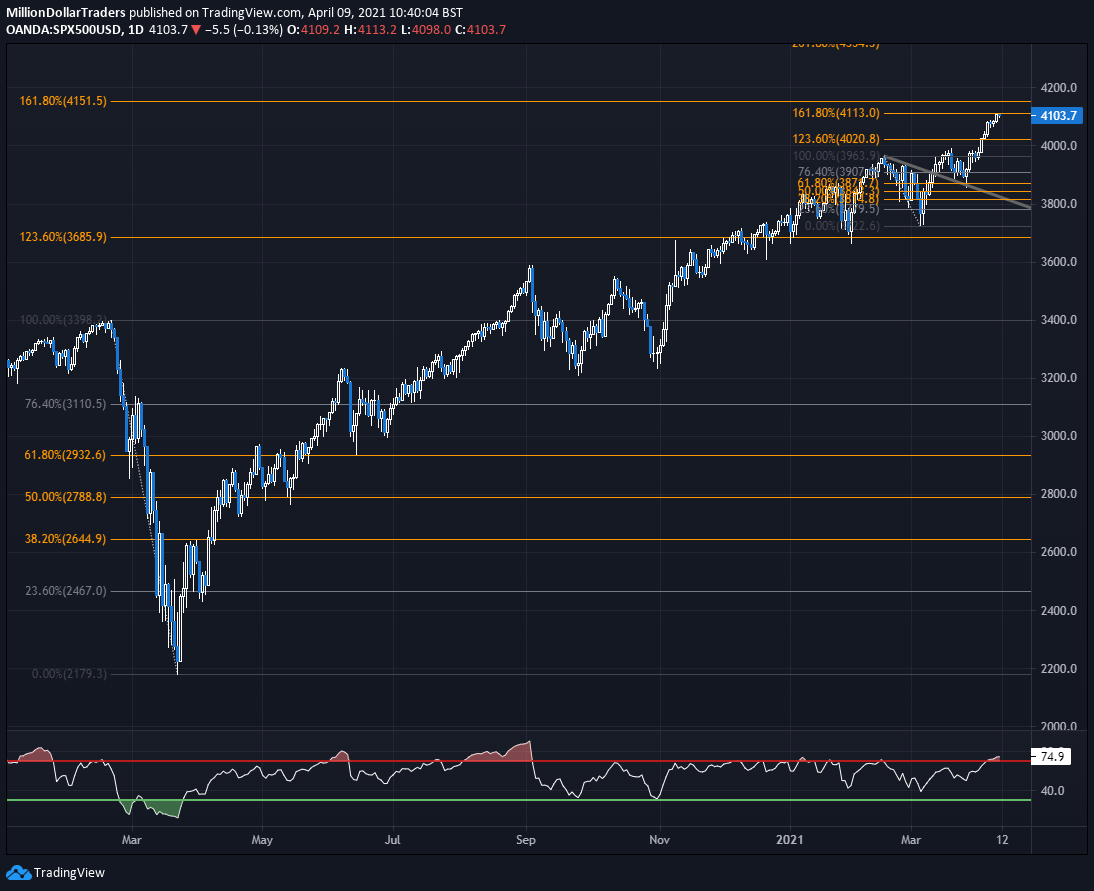
I wouldn’t mind a small correction in the trend, as I see this as an opportunity for me personally to add to positions on any weakness. This could be a more likely scenario than you might think by looking at the chart alone, which appears to have been a one-way bet recently. In fact, our US Equity Checklist has actually weakened this month which suggests that some of the momentum we have seen may begin to subside until or unless there is a new catalyst. The score remains positive nonetheless, though it does offer a note of caution to perhaps not get too far ahead of ourselves this month (particularly when the chart looks temporarily overbought).
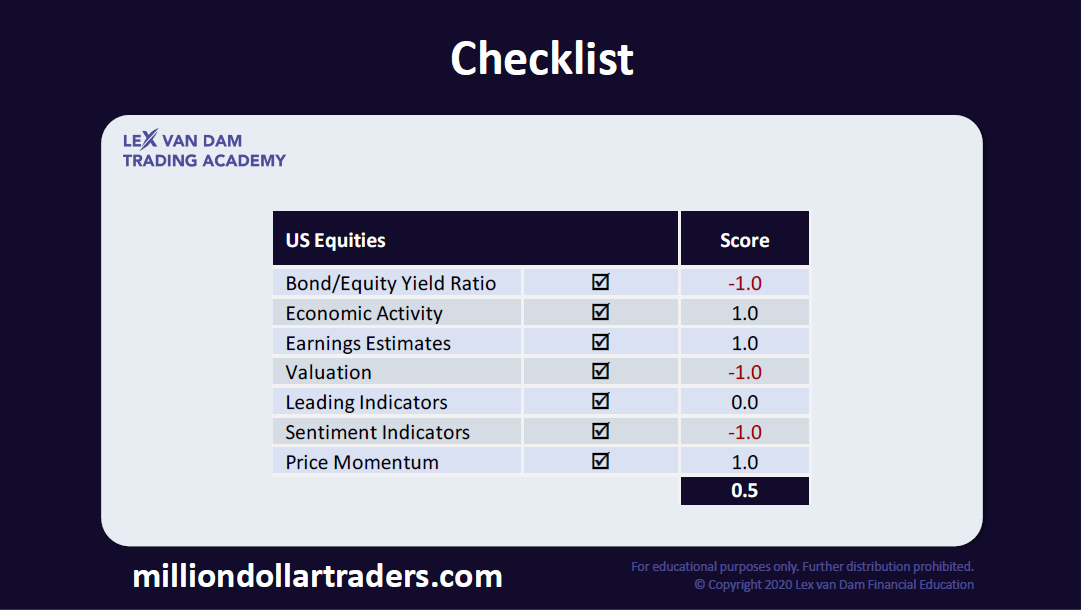
There have been some similarly interesting changes in the scores for the other complimentary Checklists that we produce for our Trading Club members, as I of course featured in this week’s video analysis. By no means do I want to come across as though I am pouring cold water on the rally, but a score of +0.5 is barely above neutral and suggests that overbought extremes may provide a good opportunity to book some profits.
To balance that statement with a longer term perspective, it may be a good time to remind ourselves of the bigger picture for cyclical assets, like stocks. Here you can see the positive score that we have for our Business Cycle Checklist, which has improved this month to a level of +2.5. This in my view validates the normalisation in interest rates which the bond market has been anticipating, but also very much supports a continuation of the bull run in stocks.
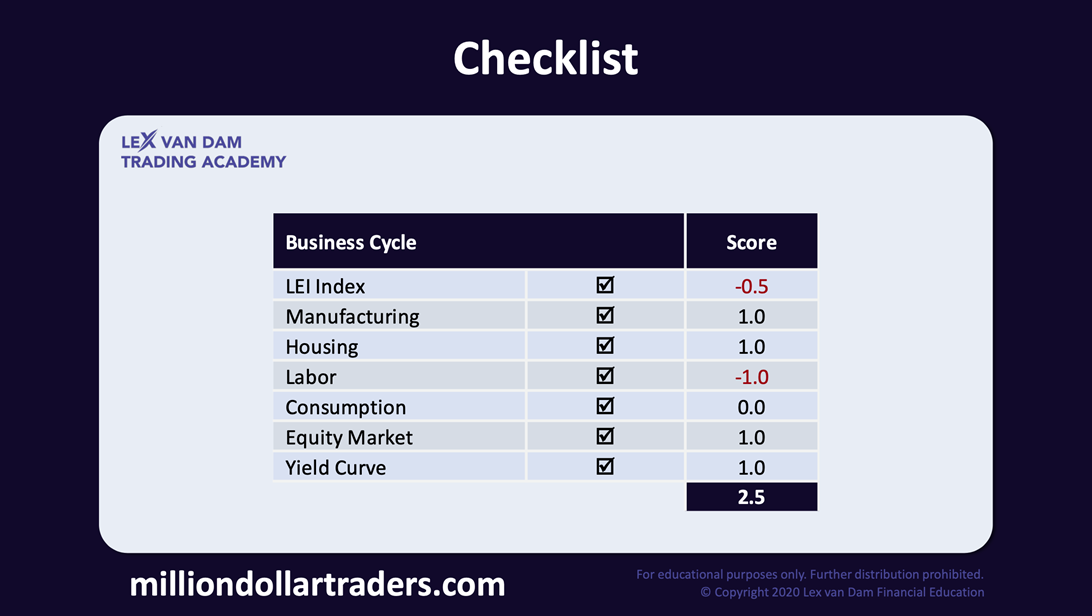
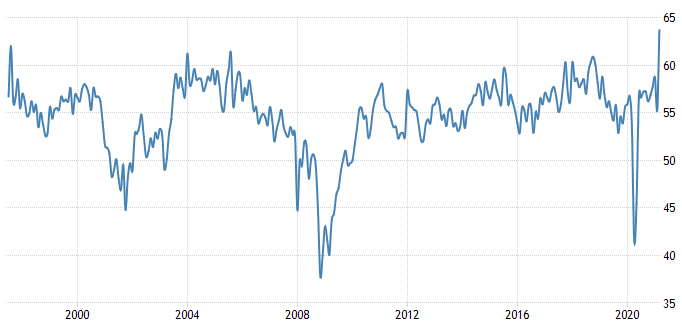
One of the key components amongst these indicators is the ISM Manufacturing PMI, which last week increased to the highest level in over 35 years. I commented on this last week and explained why this leading indicator is one of the most important in the world for anticipating the future direction of the US economy, and as such the stock market.

In addition, the ‘services’ (Non-Manufacturing) variant of the ISM PMI also jumped to the highest level on record which absolutely confirms the broadening in the economic expansion following the 2020 recession.
Overall, the outlook for the economy and cyclical assets including stocks is seen to be improving, even if there may be some profit taking in the very short-term. Guided by our process, I am prepared )along with our Trading Club members) to take advantage of any tactical opportunities which may arise. To learn more about our methods, and join me for more analysis in real-time, check out our MDT course and Trading Club pages where you can preview everything that we cover.
In the meantime, why not head over to our YouTube Channel for our latest FREE videos which I will be bringing to you each week in 2021! As there’s no charge for this content, it would be great if you could support the channel by leaving a comment and subscribing.
Have a great weekend,
James
Disclaimer: For educational purposes only. Even though we do our best to provide reliable data, you should not trade based on this information.
© Copyright 2021 Lex van Dam Financial Education. Further distribution prohibited.

